Today we’re announcing that we’ve more-than-doubled the number of black hole collisions which we’ve observed using gravitational waves. We’re also releasing an enormous amount of data collected between May 2023 and January 2024 which measures tiny changes in the Universe’s geometry measured by gravitational-wave detectors, which are how we identify these collisions. We collect the information about these collisions into publications which we call a “catalog”, which contain all of the information we’re able to extract from the signals we detect and interpret. This includes things like the mass of the objects which were colliding, how fast they were spinning, and whereabouts in the Universe they were. We’ve published earlier versions of this catalogue before now: GWTC-1.0 has events from the first two observing-runs, GWTC-2.0 adds events from the first part of the third observing-run, and GWTC-3.0 events from the second part of that run. GWTC-4.0, which we’ve released today on the arXiv, is the latest version, analysing the first part of our fourth observing run (O4a). The amount of information in these has become so large that we now split the publication describing the catalog into three parts: an introduction paper, a paper describing the methods used in the analyses, and the results of those analyses. I’ve had the pleasure of leading a team which performed one of these analyses (the “parameter estimation” analysis), which takes signals which have been identified in the data and then works out the properties of the black holes and neutron stars which produced them. It took around 60 of us to do this (and there’s more about that later in this post). I then took-over as the editor of the results part of the catalog publication in June. It’s quite nice to know that I’ve joined a bit of a Glasgow tradition of doing this: my line-manager John Veitch was responsible for GWTC-2.0, and my colleague Christopher Berry for GWTC-3.0. I can only apologise to either of them if I ever thought they seemed to have an easy job!
This is by some way the most complicated project I’ve ever led, and I think that not only are the discoveries that we’ve made interesting, but the entire process of getting here was too. This paper has a backstory worth celebrating, one with a cast of hundreds. But first, the results.
You can read the paper free-of-charge here.
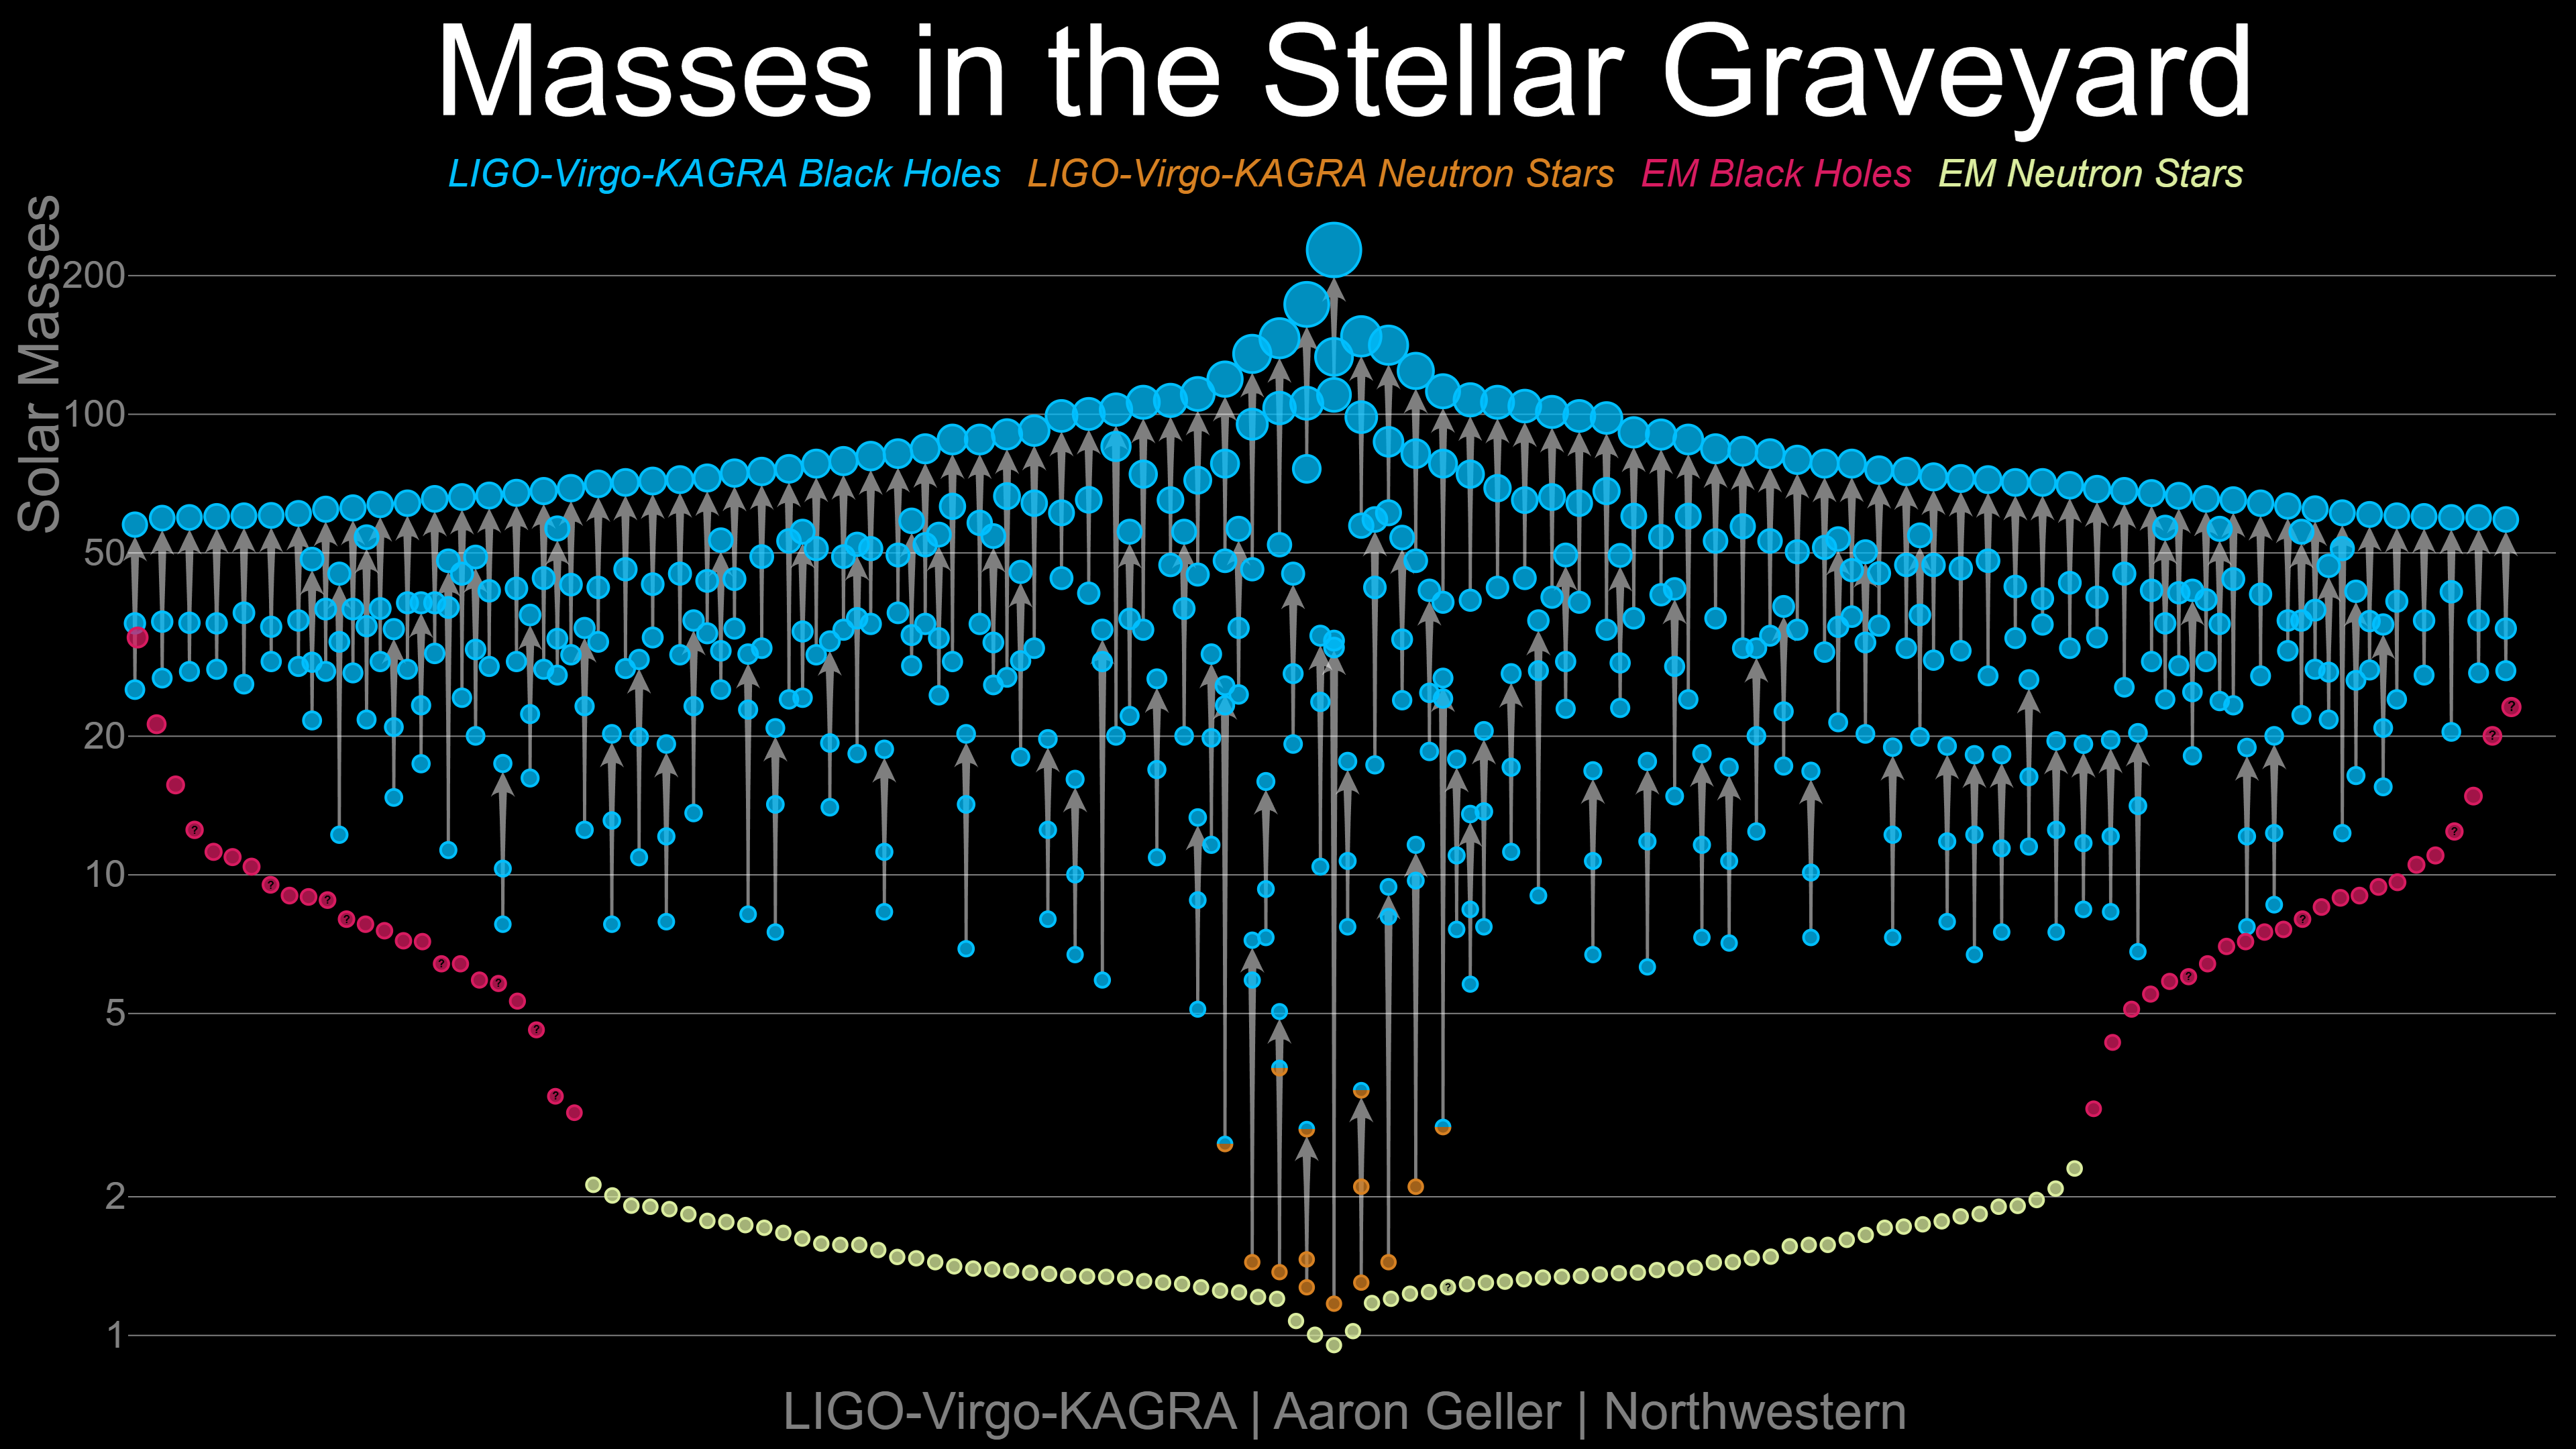
In O4a we detected 128 signals which we think were produced by either black holes merging with each other, or black holes merging with neutron stars. In the first three observing runs we’d detected a total of 90, so this has been a big step-up in terms of the number of signals we were trying to analyse. Two of the new events are from neutron-star black-hole mergers (NSBHs), and the rest were from binary black hole mergers (BBHs). We didn’t see any new binary neutron star mergers (BNSs). While the latter type of event is probably the one we get most excited about, having such a wealth of black-hole signals does a lot to deepen our understanding of the Universe. We’ve seen the heaviest pair of black holes so far colliding (we announced this separately back in July as well, and I spoke briefly about it on TV (where they called me Professor, which was nice but does not seem to have come with a pay-rise…). After these had merged they made a monster black hole weighing-in around 236 times heavier than the sun. We also made the clearest detections yet. Since they were first turned-on ten years ago enormous amounts of research and development has been focused on making the detectors better and more sensitive. This normally means making them less noisy so that they’re able to detect quieter gravitational-wave signals, but it also means that we detect loud signals even better. When we observe these loud signals very clearly we can glean even more information from them. The loudest signal in this new catalogue is called GW230814_230901 (our signals get named after the date and time we detect them, this one was found on 14 August 2023 at 23:09:01 UTC). We’ve been able to make very precise measurements off this, so much so that it’s getting its own paper which should be appearing in the next week or so. (Tangentially, 14 August seems to be one of the Universe’s favourite days for interesting signals; in 2017 we had the first three-detector detection, in 2019 we had an unusual looking signal which as I write this is causing excitement in the popular science press, and in 2023 we had this signal).
We’ve now become very good at detecting and measuring BBHs, and this is allowing us to begin to see trends in the overall population of black-holes in the Universe. However, we’re still seeing systems which stand out. These include systems where both of the black holes are spinning very fast, where one black hole is much heavier than the other. In the not-too-distant past the measurements of each individual BBH was a headline event, now we have so many results we can start to perform even more exciting analyses based on the signals en-masse.
The scale of this new catalog posed an enormous challenge to us. Not only does it contain more signals that we’d ever had to analyse for a single publication, but the analyses themselves are more complex. We need to compare the signals to a mathematical model in order to extract the properties of the mergers. Lots of these models have been created, which ultimately aim to approximate General Relativity, which is Einstein’s theory of gravity. The mathematics of that theory is too complicated to use directly however. It’s a good idea to perform an analysis with multiple of these models so that you can check for places where one might be less accurate than another. Up to GWTC-3.0 we used two models. In GWTC-4.0 we used four for lots of events, three for the majority, and at least two for everything. Not only did we have more than twice as many events as we’d ever tried to analyse all at once (the previous record-holder was GWTC-2.1, where we went back and reanalysed the O1, O2, and O3a events with new techniques developed for O3b), but we’d deliberately made life difficult for ourselves by adding in these new models. We took our detectors offline in March 2020 for planned maintenance which would ultimately improve their sensitivity by about 25%. While our collaborators who know how to do things with lasers and the like were getting on with that those of us who spend our time writing code got on with solving a problem they were creating for us: how do you analyse all of the extra events we’ll now see? Part of the solution was that lots of the analysis codes were carefully reworked and improved so that they would run more efficiently, and ultimately, faster. That helped a lot. The teams who run all of the computing facilities we rely on also put a lot of work in so that all our geographically spread-out computers would talk to each other better, and could better share resources. We made new tools to allow us to store and share information better, and we continued to make our analyses easier to set up, so that we could spend more time looking at the results, and less time setting them up and checking them as they ran.
Still, you might be thinking that it’s taken us a very long time to get these results out: after all, we stopped collecting the data in January 2024: that’s more than a year-and-a-half ago. It’s not quite that simple though. First a lot of work needs to be done to check and calibrate the data, and we can’t start work on our final analyses until that’s all been done. Then we need to do the final “offline” searches for signals in the data. We only perform our really detailed analyses on small parts of the data we collect which we’re confident have gravitational-wave signals in them, so this stage is another important prerequisite. All of this meant that we weren’t in a position to start the final analysis until last summer. We put together a team of about 60 people from across the three collaborations (LIGO, Virgo, and KAGRA), and got to work. Most of that work comes in checking the results of analyses; there are lots of ways these can go wrong, and we discovered a few new ones this time around! This means that we need to adjust some analyses and then re-run them to fix the problems we identify. We analysed 86 of the new events this way, so we had hundreds of analyses to check. Having a big team helped to make that easier, and it was a good opportunity to teach lots of people about all of the intricacies of gravitational-wave parameter estimation. This will mean our next update will have an even more experienced team behind it. Things got off to a great start, and the first set of analyses we ran looked good. However, we discovered a bug in part of the analysis thanks to the careful checks which we were doing. This meant that we needed to restart everything after about six weeks. That was frustrating, but point to the high level of review and quality assurance which goes into our results. By the autumn we were almost done with phase one of the analysis, and checking over the results. (We ran the project in two phases; in the first we analysed each event with just one model, and in the second we analysed them with the other models). However, through a series of events which are themselves interesting (but I’m not quite ready to tell this part of the story; watch this space!) we discovered another bug in the analysis. This one turned out to be quite hard to fix. It took us up until Christmas to get everything fixed, the analyses run again, and the results all checked. The last email I sent before going on my festive break was to announce that Phase 1 was complete. Getting this finished as early as we could was important. There are more analyses now which rely on the results of parameter estimation, this careful decrypting of the signals to interpret the astrophysics of the black holes and neutron stars which are colliding. (You’ll be able to learn more about those over the coming weeks as more are made available online). These analyses are complex, and as a result, can take a long time and use a lot of resources to run. As a result we’re under pressure to get the results to them as quickly as possible so that they can get their work finished. Why the big rush? Well, we always knew that the data from the detectors would be made public in August 2025, and we wanted to make sure we could discuss it in detail when that happened. After Christmas phase 2 of the analysis went smoothly, and we managed to complete all of the additional analyses by the spring. After almost a year of work the team was able to enjoy a change of focus. I started to plan my summer holidays. (My big goal for this year, outside gravitational-waves, anyway, was to finish climbing all of the Munros [mountains in Scotland over 3,000 feet tall]. I had 64 left to go, and I had an intricate plan…) I spent some time doing other things, helping our research group in Glasgow to prepare for hosting a massive conference, being best man at my friends’ wedding, and enjoying the weather slowly improving.
In late May I got an unexpected email. “Would you like to take over as editor of the GWTC-4.0 results paper?” it read. I thought about this. I looked at the intricate plans for 64 big hills. No, I decided. That seems like a lot of work. But I didn’t send the email right away. I slept on it. This was arguably a bad idea. I chatted to some people in work, assuming they’d agree that it was a lot of work and that maybe I deserved a nice relaxing break. Dear readers, they did not. I replied to that email “yes, sounds good!”. The previous editor had taken-up a job outside academia, but the paper had been rapidly maturing for a couple of months, and since my team had handed over the final results it had started to accelerate. I was trying to take-over mid-flight. Fortunately the team writing the paper was excellent, and coped very well with me coming in and making a mess while I tried to learn the ropes!
At this point I want to digress slightly to explain how we write papers in the collaboration. There are far north of a thousand authors on these papers; how on earth do you coordinate this? It turns out that I did not know the correct answer to this question in May. In essence, a small team of six or seven people takes charge of writing the paper; they’re the paper writing team. In charge of them is the editorial chair (that was the job I was rapidly trying to learn), and the paper manager. The editor is responsible for making sure that what goes into the paper is coherent and makes good scientific sense; the manager is responsible for making sure that they do it on time. The best analogy I’ve ever heard was from Mark Hannam who described the editorial chair as the director of a movie, and the manager as the producer. From this point forwards I will happily equate myself with Peter Jackson, Steven Spielberg, and Alfred Hitchcock. Once this small group has written a draft (or initially, just a skeleton of what they think the structure of the paper should be), they “circulate” it to the whole collaboration. Everyone gets a chance to tell them what they think is good about the paper, and what they should have done completely differently. The team then goes away, thinks hard about how to reconcile what can sometimes be completely contrary suggestions, and a few weeks later they come back, and circulate it again. I took over just after the third of these circulations had happened. This is the big one; it’s the one where the results are meant to be close to final, and where people really start paying attention. Dear reader, there were hundreds of comments. They ranged from “you missed a few commas”, to “you need to change the title”, to “you need to completely rewrite this section”. This all happened in the middle of June (which is the last time most people I know who don’t work in astronomy saw me). We had a very short amount of time to turn around the next version, which needed to circulate before 4 July if we were to have any chance of completing the remaining steps on time. Things were made harder, because that big conference my research group was organising was about to stop everyone in the field doing any other work for a week. We substantially improved the paper in that time, and we recirculated again. We were happy that we’d addressed almost all the problems, so it should be plain sailing from here. Then the comments started to come in. This is the last time that most members of the collaboration can express their opinions about the contents of the paper and expect the writing team to act on it, so this is the point where people really take notice. I think it’s safe to say I hadn’t anticipated the amount of attention we’d now receive (and given I’d been telling everyone this was the “flagship paper”, perhaps I should have expected it…). We spent almost a month editing the paper, and making it a lot better. (As much as this process means you need to do a lot of work, it does leave you with a very refined manuscript at the end!). The Amaldi conference happened. I then disappeared to the Highlands for two weeks (with my laptop…). I climbed a lot of hills; I spent several hours each evening editing the paper. It was not quite the holiday I’d imagined, but it worked. It worked thanks to a very dedicated team who were surprisingly tolerant of me going off-grid for 28 hours on at least one occasion. Finally, just over a week ago everything was refined, distilled, and ready. Now, things should have been straight-forward at this point, right? Well, it turns out there was another surprise in this process. Shortly after we’d completed that circulation at the start of July a third bug was identified in the analyses. This one was probably the most serious yet, and has existed, it turns out, in all of the analyses we’ve performed since the very first, GW150914. It was now too late to redo all of the analyses. Or so we thought. We came up with two plans. We had a way of correcting the results from the bad analyses which was satisfactory, but not ideal. It would take a bit of work to apply this to all of the results, and then check that everything made sense, but this would otherwise be quite a quick solution. The alternative was to try and draw on everything we’d learned in the last year or so, and try and rerun everything in less than six weeks. We decided to try both. This meant that I got to put on my analysis lead hat one more time, while trying to balance it alongside my editor hat. We set up hundreds of analyses, and watched them slowly but surely consume all the computing resources they could access. All this while we were editing the paper, and I was trying to climb as many mountains as possible in a fortnight. In the end the process which fixed the samples worked better than we had anticipated, and we’ve ended up using those. The reruns, as it turned out, also finished before we needed to submit the paper, however, the process of reviewing all of them meant that we’d struggle to get everything finished and checked on time. We’ll swap these in when we update the paper as it goes through peer review. It’s a real testament to everything that we’ve learned that we managed to do this as quickly as we did however.
I digress. Just over a week ago we had an almost-finished paper, and we sent it for its final stage of circulation. In this one it goes to the senior leadership of the collaboration to review. First it goes through “editorial review” where a team checks the text of the paper is inline with the collaborations’ editorial standards. Then it completes “technical review”, where a team checks that all of the analyses and results make sense. These two steps mean a lot of coordination between yet more teams of people. I think I owe a lot of people apologies for the number of emails I sent them during this process! Finally, the senior leadership have a chance to give comments, and the paper team makes changes to address those. That brings me to Saturday morning, where a few of us were frantically adding that final polish. On Saturday afternoon we got “management approval”. We would be allowed to release the paper on Tuesday.
And that brings us to today. The paper which I was editor of was released on the arXiv this morning. It’s part of a series of papers. What used to be the lengthy introduction and methods sections of previous catalogue papers have been split-out into their own publications which are also appearing today.
In addition, we’ve also got a publication which looks at the astrophysical consequences of our observations. I’ll write more about this and other companion papers in the near future.
I hope you enjoy reading the paper as much as I enjoyed seeing it through so many stages of its development! I am really proud of how much work so many people put into finishing this. It’s the biggest set of new results ever put together in our field. In a few weeks’ time we’ll be celebrating the tenth anniversary of our first detection on 14 September 2015. It’s exciting to see just how far we’ve come, and to think about how much is still to come: this analysis is only of data taken up to January 2024. We’re still observing today. Stay tuned for some very exciting announcements in the coming weeks! For now, I’m going to catch up on some sleep, and see if I can find a plan to climb the 24 Munros I’ve not quite managed to find the time for yet this summer.