I recently ran the Great Scottish Run half marathon in Glasgow, and finished in what I figured was a pretty decent time. But of course, this just leads on to another question: what is a “good” time in the half marathon? Of course, one of the beauties of a sport like running which is so individual is that a good time is really what you make it, and nowhere is that more true than a mass participation event like GSR. But again, before I dive into the statistics, a good time in the half marathon is clearly one that you’re happy with, and comparing yourself to others probably shouldn’t be why you’re running.
With a little difficulty I downloaded the results from the 2023 iteration’s website, and I’ve done some very basic analysis on them, which are, I think a little interesting. And yes, I’ve answered my question: did I really do well.
Distribution of finish times
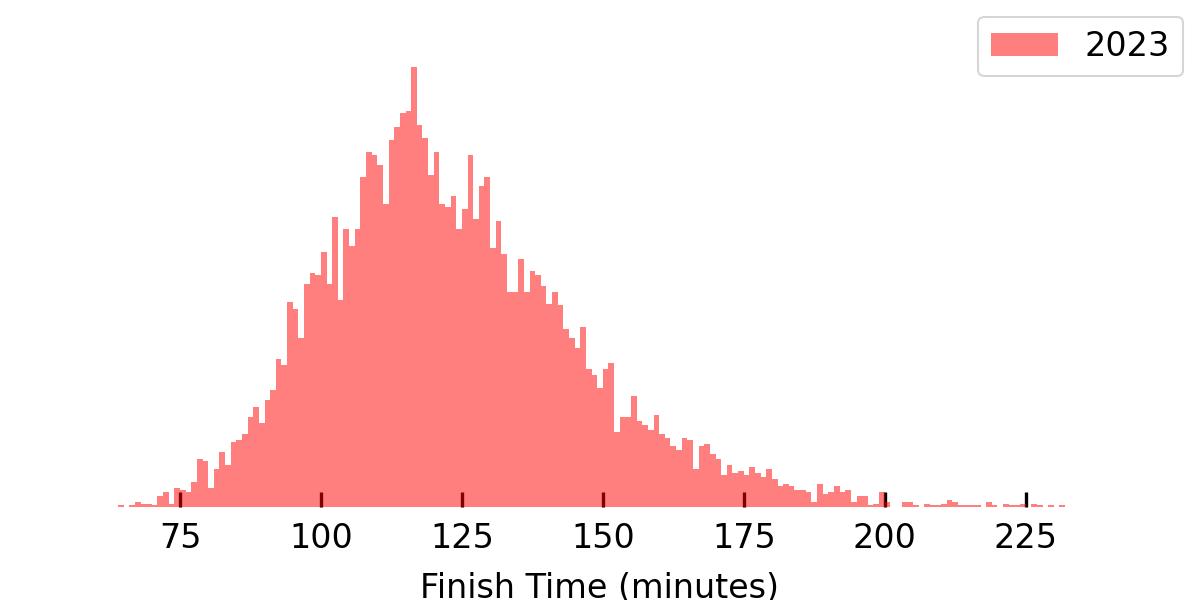
First let’s look at the histogram and then the estimated distribution of the finish times.
I was expecting a noticeable set of “jumps” or spikes in the data around what people considered good times (for example, around 90-minutes and the 2-hour mark). I was surprised to find those aren’t really evident in the histogram of results, and applying a kernel density estimate they’re completely smoothed out.
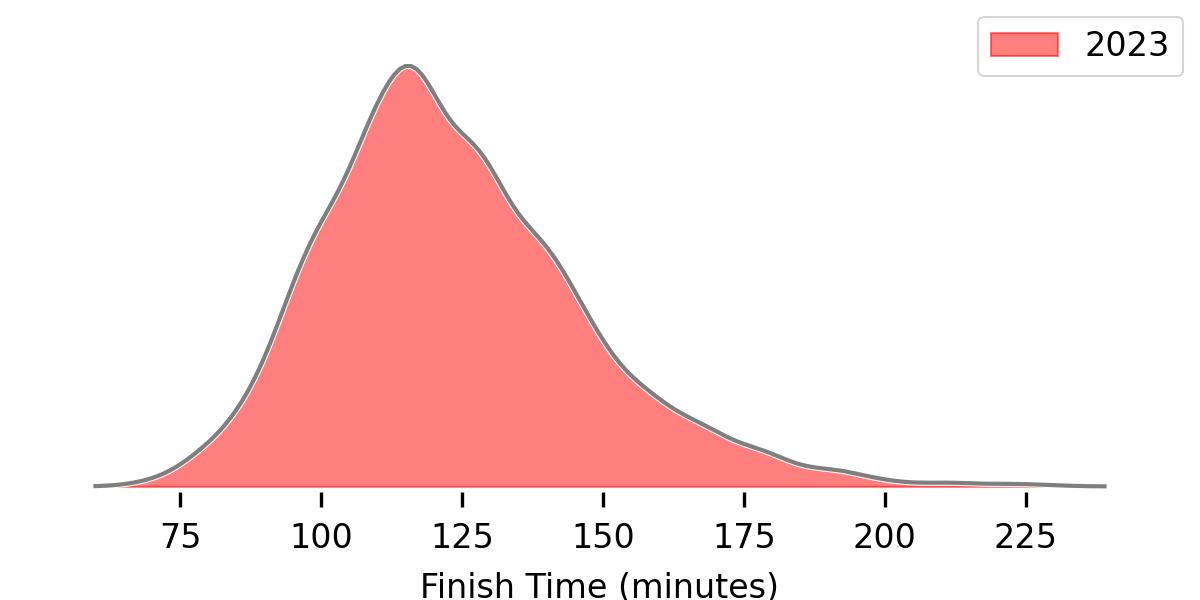
There are some interesting features in these distributions. First is the long tail, which is perhaps not very surprising, but gives the distribution a pleasant non-Normal character stretching right out close to the four hour mark. The histogram possibly does show a feature at 150 minutes (but it’s a bit hard to be sure by eye); it’s possible that this was from one of the pace groups (there were pacing runners at ten minute intervals from 90 minutes all the way up as far as I could see on the day).
The median of the distribution sits at 120.5 minutes, which is pleasantly round.
Does being in a club help?
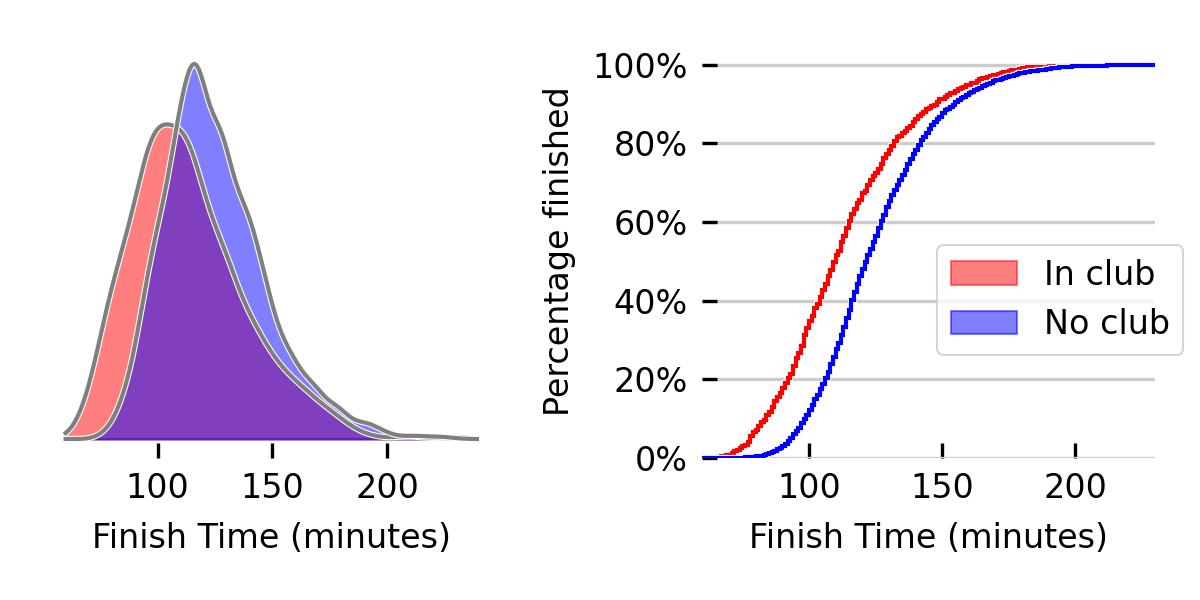
The data I’ve downloaded don’t have a lot of additional information beyond the finish times, except they do list the name of a runner’s club. I figured I might as well have a look at how the distributions of club and non-club runners compare, and I’ll be honest, I was surprised.
While cause and effect are probably hard to pick apart here (does being in a club make you faster, or do faster people join clubs?) it’s very clear that club runners are faster. A lot faster. The median time for a member of a club to finish was 110 minutes; non-club runners’ median was 122. This becomes even starker at the sharp-end of the tables, with the top 5% of club runners finishing in under 79 minutes, whereas the top 5% of non-club runners finish in under 94 minutes.
I’m a member of a club (Westerlands CCC), so the pressure is clearly on me to have performed well…
Did the changed course affect things?
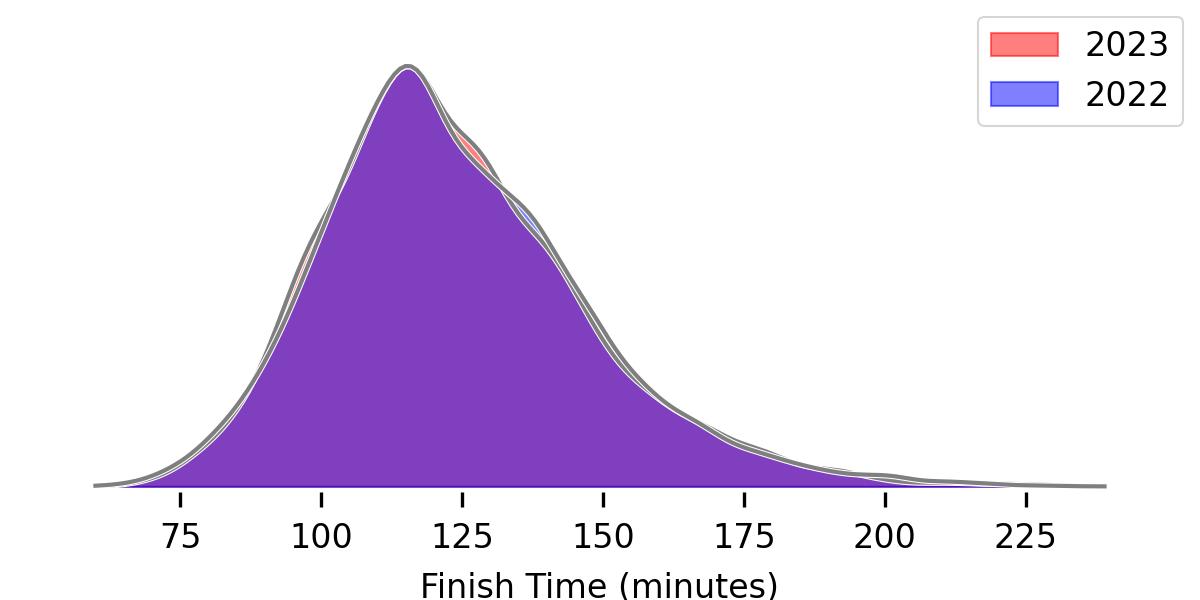
One final consideration before I decide how I compared is to look at last year’s results and compare them to this year’s. The course was considerably changed in 2023 because of extensive road closures on the South side of Glasgow. This meant that the 2023 course had an extensive out-and-back component along the largely-flat and straight Paisley Road West, and skipped Bellahouston Park, which is often the bane of many runners, as it brings a moderate hill in the closing miles of the race, which can come as an unpleasant shock.
I wasn’t personally a fan of the changes, but I’ve heard rumours that many people did like this reduction in hills. The only important question is: did this affect finish times.
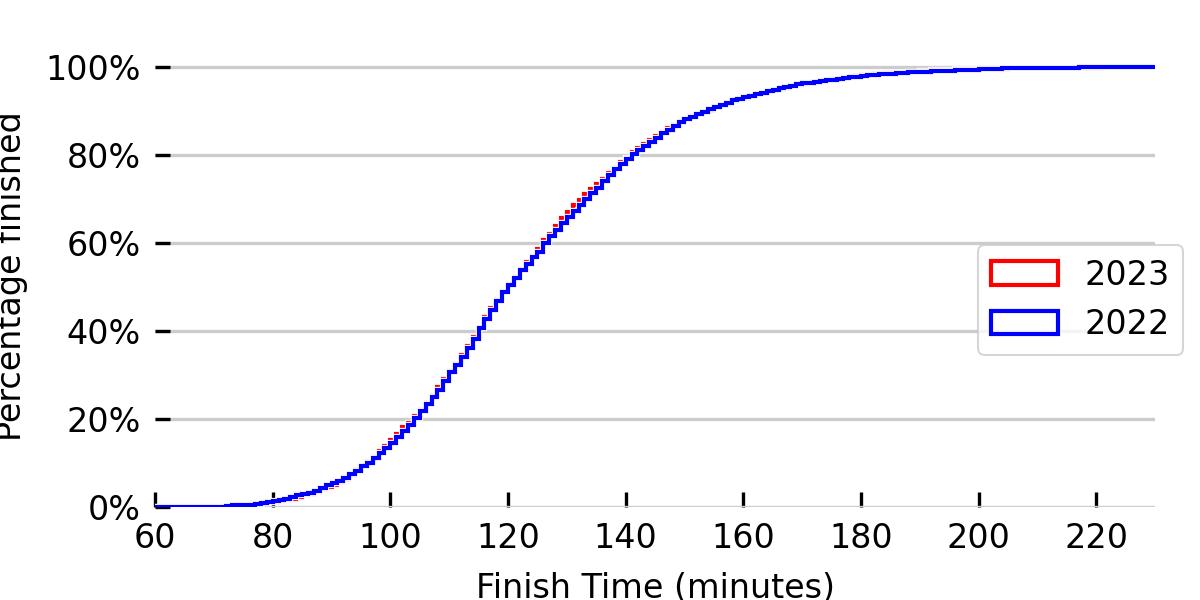
Resoundingly, the answer is no. The distributions are almost identical. That’s even more starkly depicted in the cumulative distributions, which are almost indistinguishable. I suppose the route planners did well!
So how did I do?
I finished in just under 90 minutes. 89:44 if we’re splitting hairs (which I am). That was a frustrating 34 seconds shy of my PB from 2022.
This places me in the top 5% of all runners, but also places me in the most competitive part of the club runner field, sitting somewhere in the top 20% of that sub-population.
This all said, I reckon that’s not too bad, but to get to within the top 5% of club runners I need to shave another 11 minutes off my time to go sub-79.
Anecdotally, membership of a club did have a major effect on my own finish time. Prior to joining a club my half marathon PB was 100 minutes; since joining one it’s dropped 10 minutes. It’s hard to say if that’s directly a result of me joining a club, or changing the way I trained.
Anyway, I’m pretty happy with how I did, but hopefully there’s room for improvement in 2024!
Appendix: Table of Percentiles
| Percentile | Club runners | Non-club runners | All runners |
|---|---|---|---|
| 0.05 | 78.6167 | 93.9833 | 90.7167 |
| 0.1 | 84.1167 | 99.15 | 96.63 |
| 0.15 | 88.6033 | 103.058 | 100.645 |
| 0.2 | 92.7167 | 106.85 | 104.433 |
| 0.25 | 95.7583 | 109.579 | 107.85 |
| 0.3 | 98.41 | 112.35 | 110.467 |
| 0.35 | 101.195 | 114.721 | 113.2 |
| 0.4 | 104.293 | 116.983 | 115.57 |
| 0.45 | 107.492 | 119.367 | 117.933 |
| 0.5 | 110.15 | 122.05 | 120.5 |
| 0.55 | 113.183 | 125.117 | 123.617 |
| 0.6 | 115.887 | 127.883 | 126.647 |
| 0.65 | 119.137 | 130.883 | 129.6 |
| 0.7 | 123.543 | 134.533 | 133.067 |
| 0.75 | 128.183 | 138.233 | 137.258 |
| 0.8 | 132.577 | 142.367 | 141.58 |
| 0.85 | 139.58 | 147.317 | 146.65 |
| 0.9 | 148.303 | 155.25 | 154.437 |
| 0.95 | 161.19 | 167.721 | 166.933 |
| 1 | 231.733 | 229.933 | 231.733 |