Every so often I get the notion that I ought to be taking a look at the performance of various rugby teams in various tournaments, and then trying to perform some sort of statistical analysis on it. Well, it looks like this might spin out into a series of blog posts in the run up to the 2023 Mens’ Rugby Union World Cup.
There are twenty teams competing in the tournament, and I’ve had a look at how they’ve performed over the last 4 and a half years (since 1 January 2019) as a precursor to trying to make some slightly cleverer inferences about what might happen in France this year. I’ve had a rather mixed success rate when it comes to predictions in the past, and right now I’m just going to look at the data.
First, looking at how those twenty teams have performed in general over that period, I’ve simply calculated the score difference for each match they played. If a team has a negative difference they lost their match, and a positive one means they won the match. This allowed me to produce the first plot of this post, which shows the distribution of score differences for each team since the start of 2019.
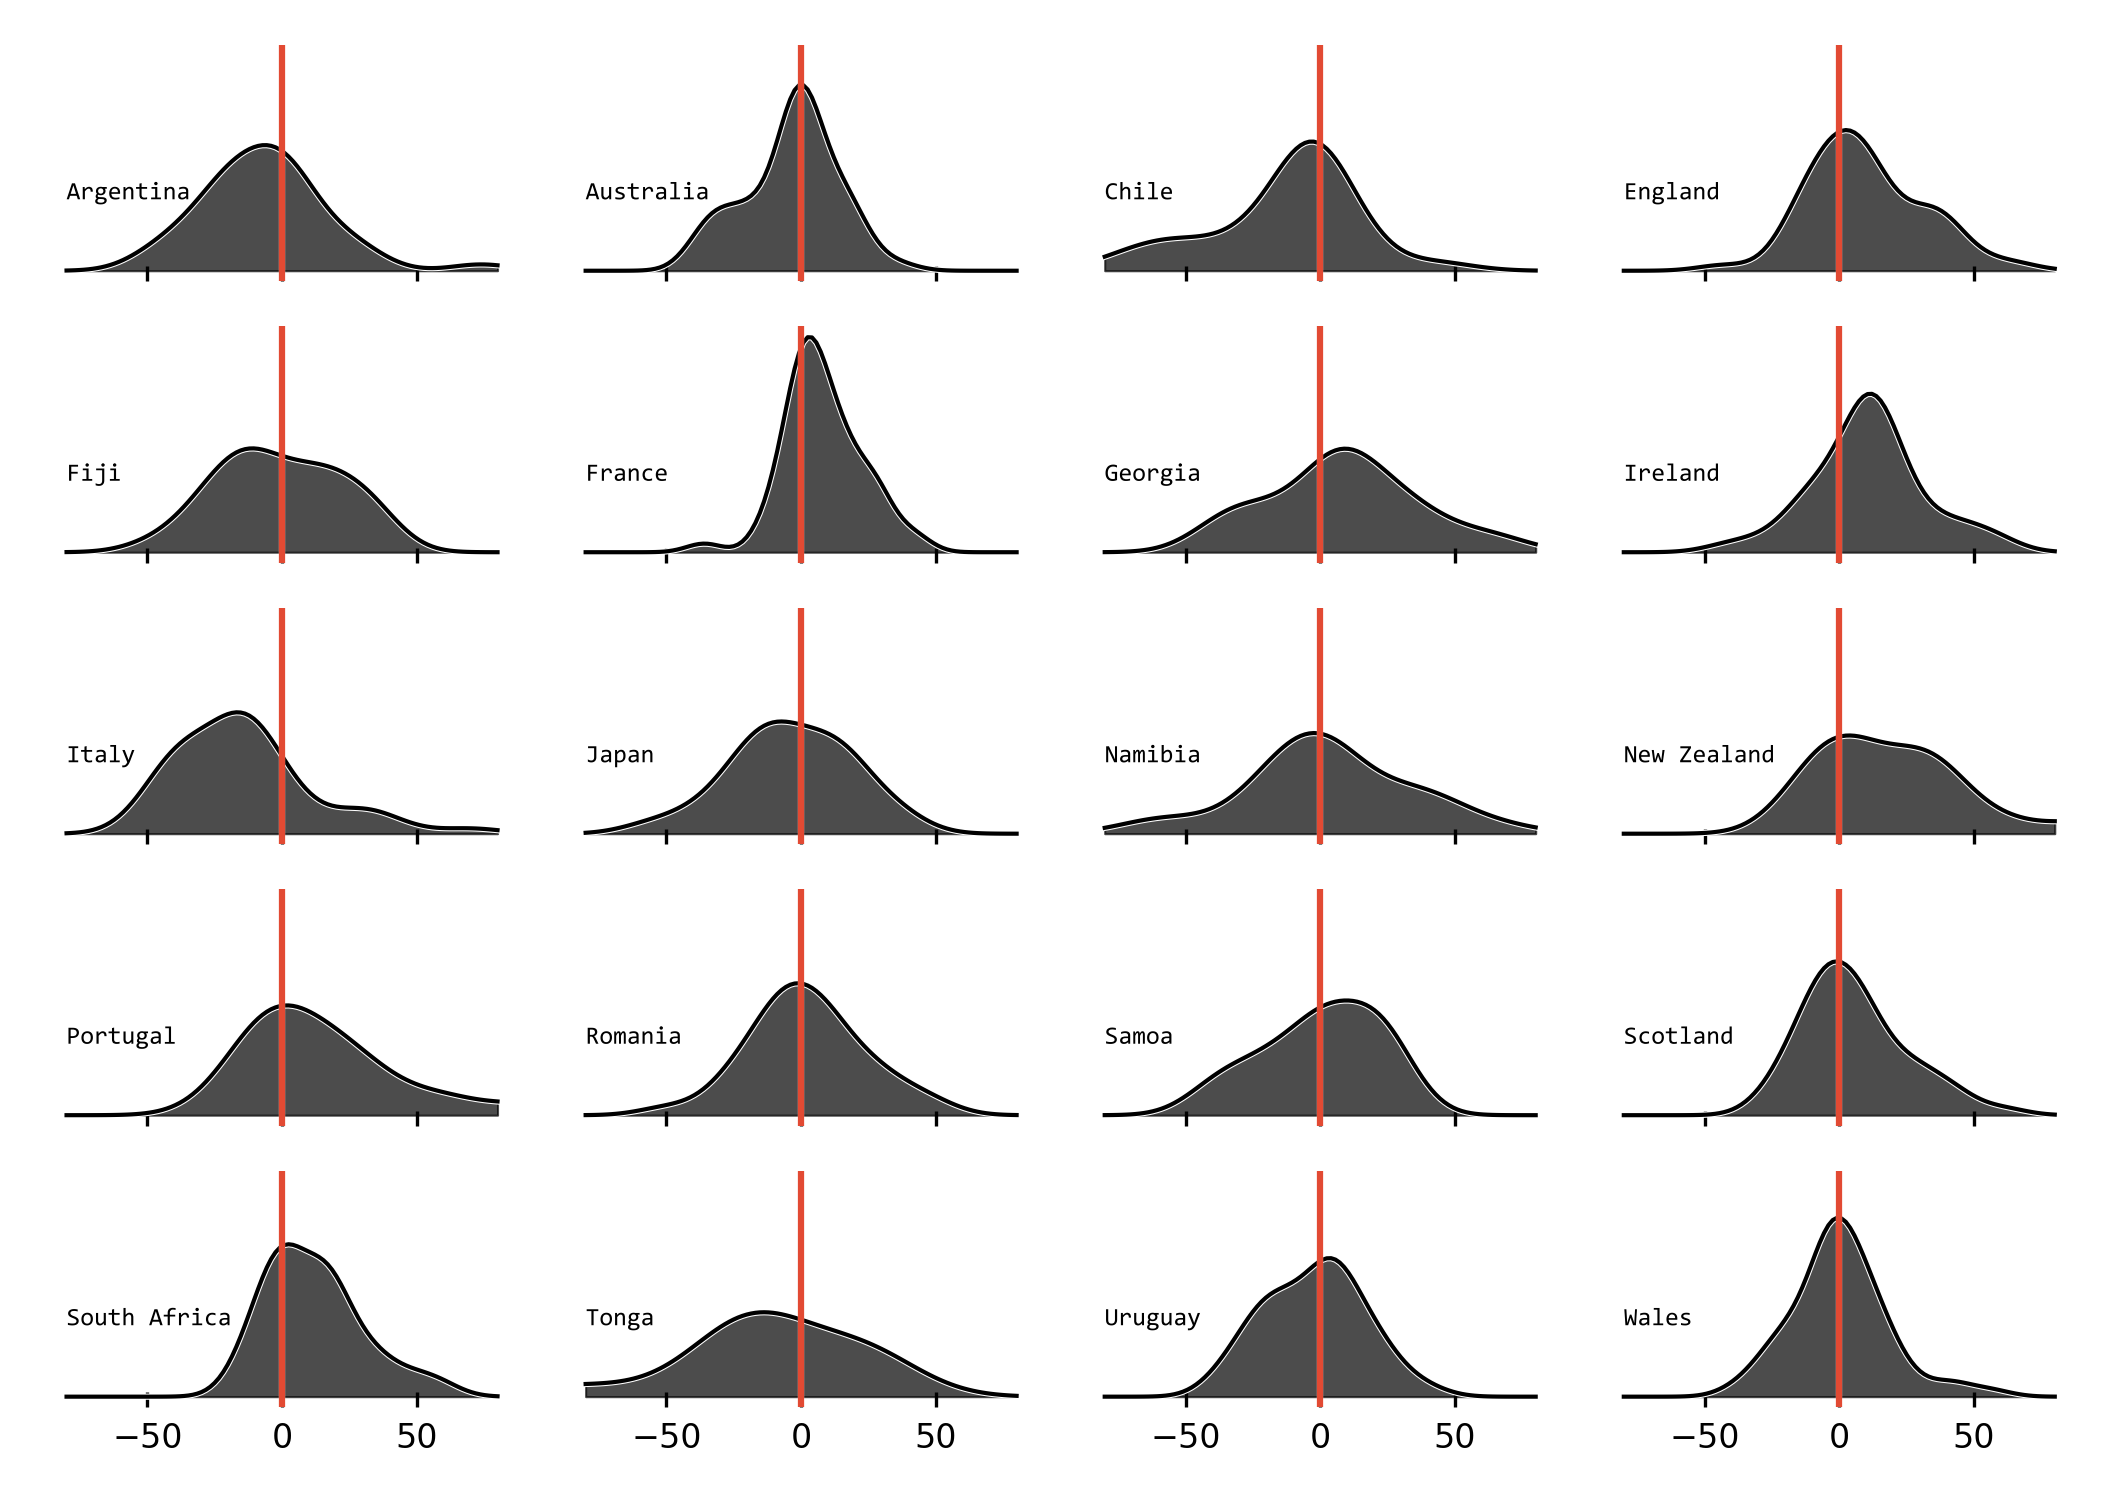
Each plot provides an estimate of the probability distribution for each country’s score difference when it plays a game. For example, Ireland is quite likely to have a fairly large positive difference (that is, win by a large margin), France is likely to see a win in any given game as well, but by a smaller margin, whereas Scotland is most likely to draw, or have either a very close win or loss. The more spread-out the distribution is, the less certain any given outcome is. New Zealand is an interesting example here: most of the distribution is positive, but it’s all quite spread out. That is to say, New Zealand will probably win a game, but it’s almost as likely to be a close-run thing as it is to be a major victory.
We can also take a look at how this has changed relative to a similar period before the last world cup in 2019. I’ve kept the 2019-2023 distributions in grey, but added the 2015-2019 distributions in red.
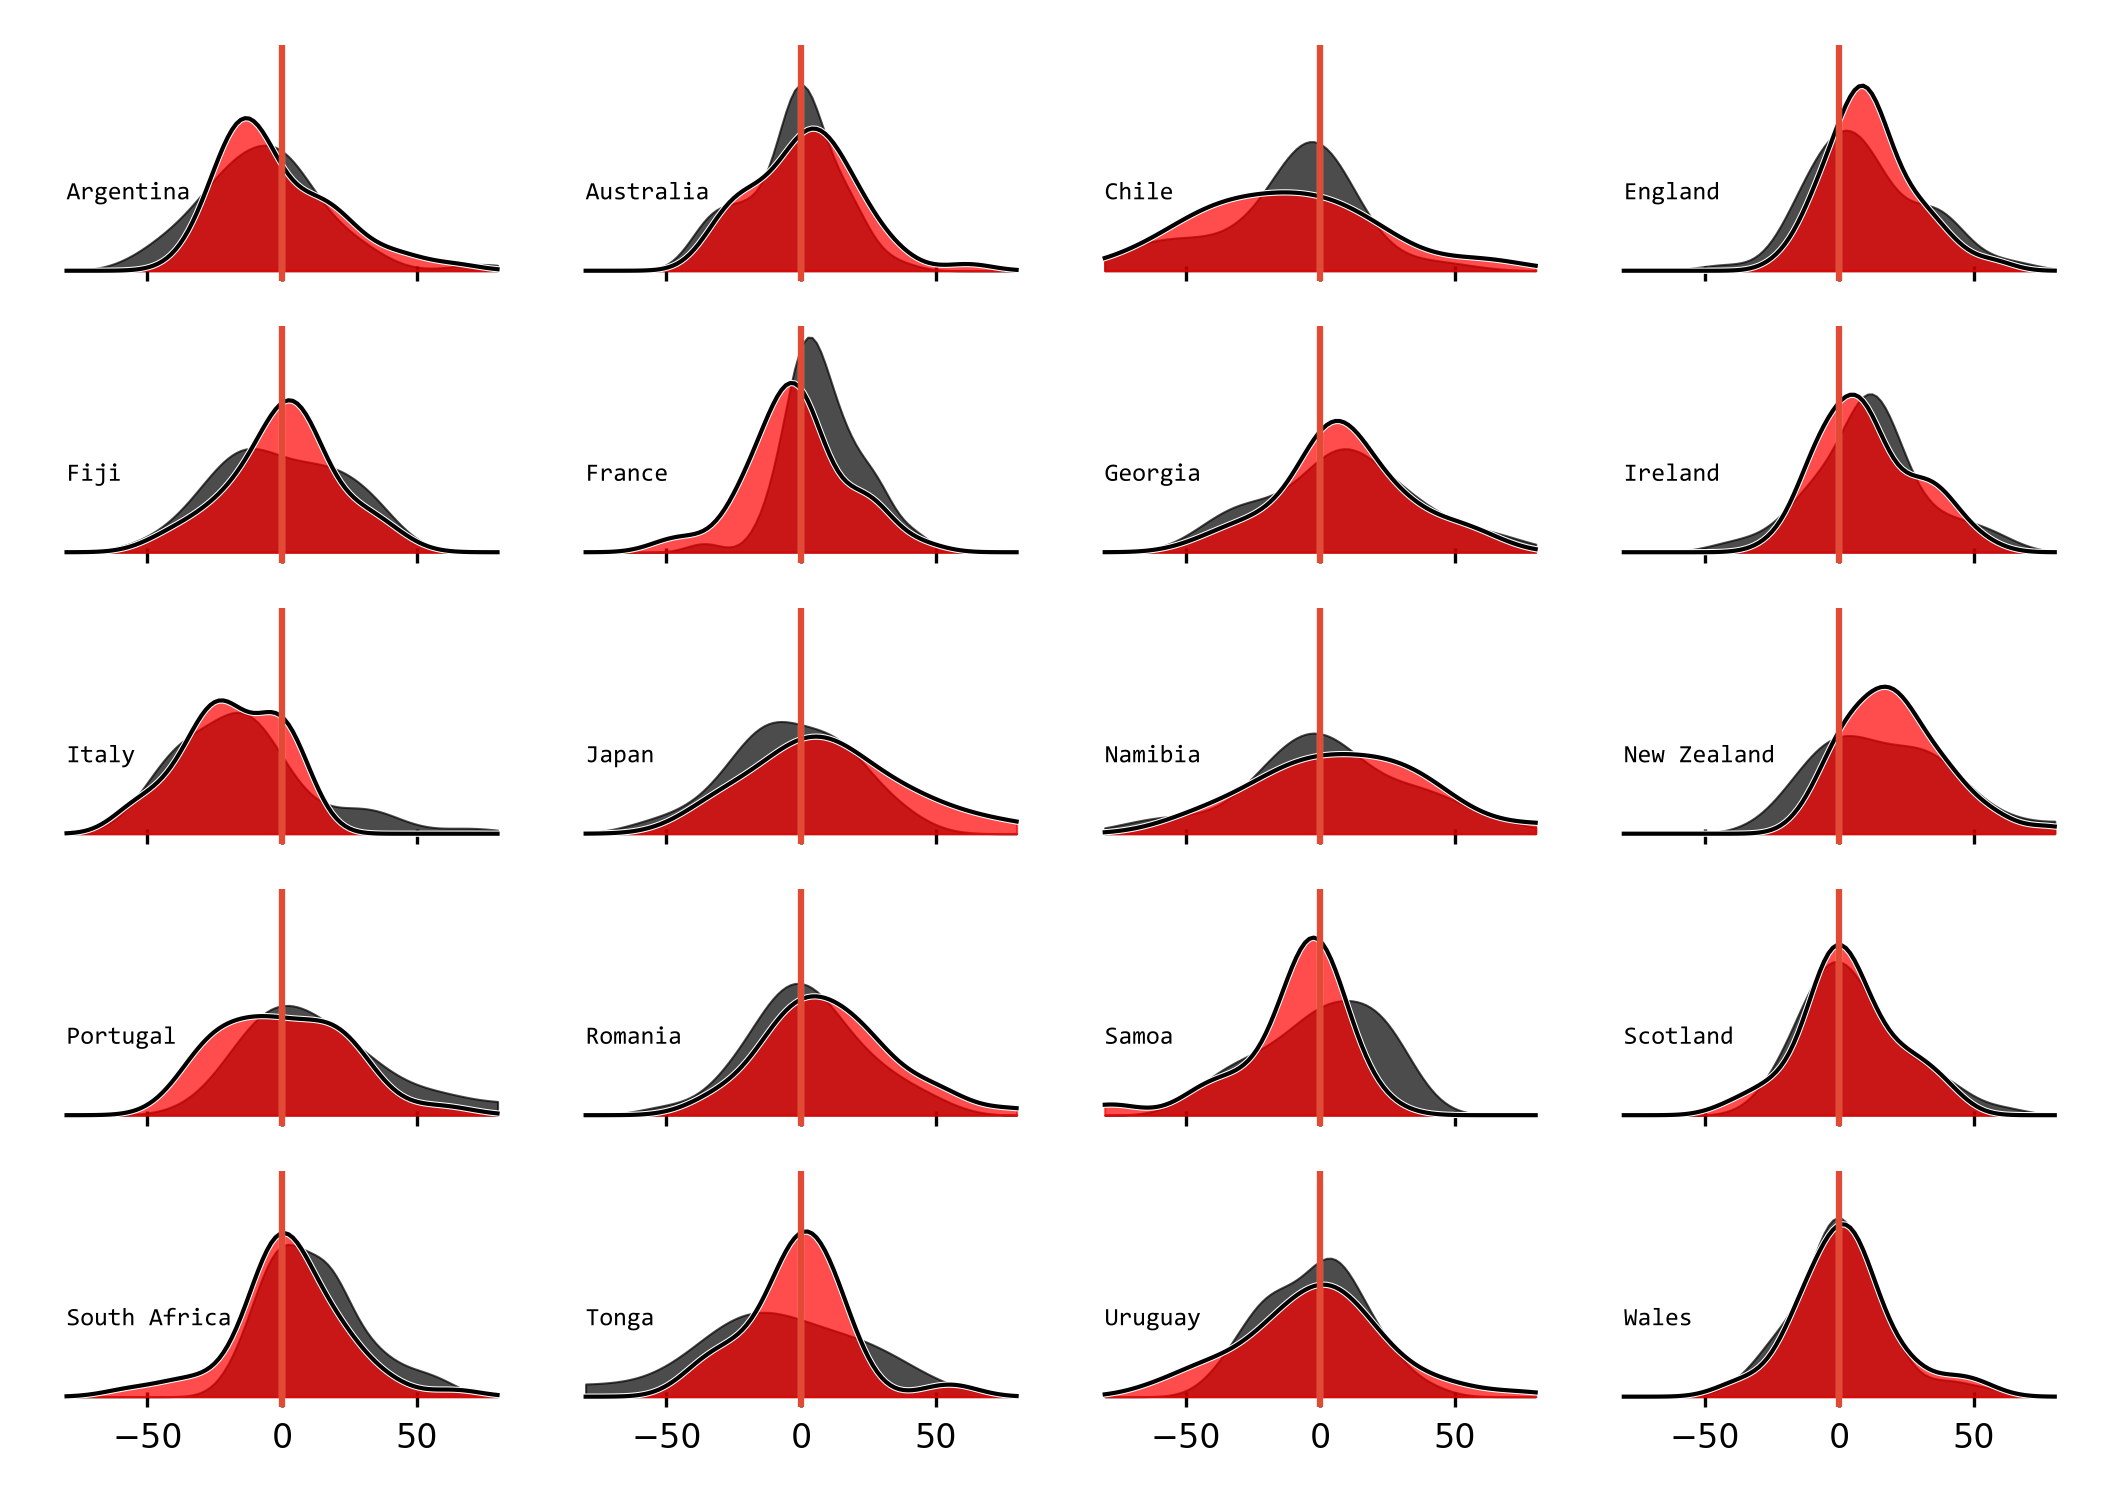
The purpose of this post isn’t really to provide analysis, but I suspect none of this will really come as a surprise, though this is Chile’s first World Cup, so it’s perhaps the first time it’s had any real scrutiny.