I’ve been playing around with a large dataset which I scraped off Wikipedia recently: the details of the various fixtures from the Pro12, a European rugby league with teams from Ireland, Wales, Scotland, and Italy.
While I’ve played around with various different ways to visualise the data, I also had a go with performing some analysis on it, specifically performing a Bayesian analysis, with the aim of trying to predict the outcomes of any given match between two teams. This isn’t the first time someone’s tried this sort of thing, but other methods I’ve seen use rankings rather than a full Bayesian approach.
I’ll keep the details of the analysis for later in the post, and just give away the results for the games coming up this weekend.
| Home | Win Chance | Away | Win Chance | Most Probable Margin |
|---|---|---|---|---|
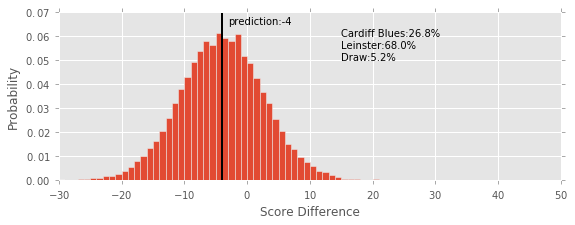
| Cardiff | 28.9% | Leinster | 65.0% | Leinster +2 |
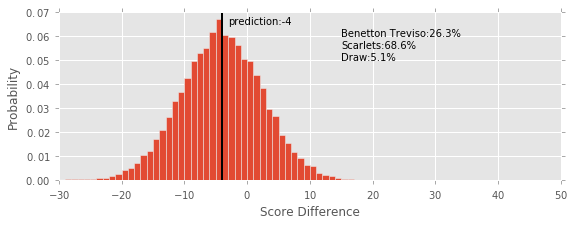
| Treviso | 27.8% | Scarlets | 66.7% | Scarlets +4 |
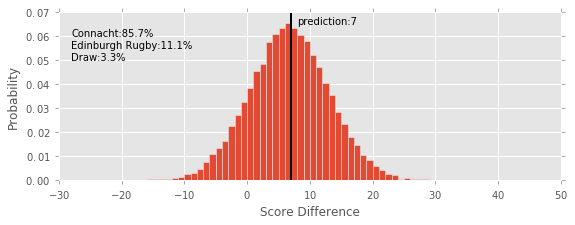
| Connacht | 87.4% | Edinburgh | 9.5% | Connacht +7 |
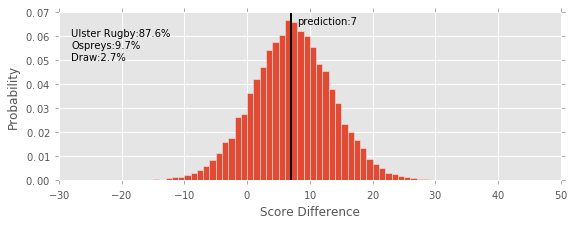
| Ulster | 88.9% | Ospreys | 8.3% | Ulster +9 |
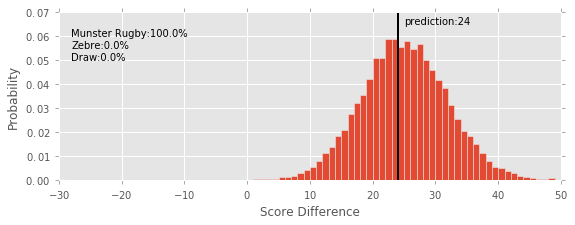
| Munster | 99.9% | Zebre | <0.01% | Munster +26 |
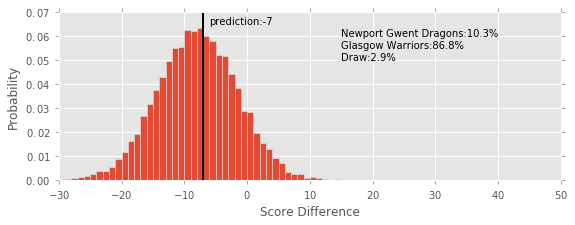
| Newport | 11.0% | Glasgow | 85.6% | Glasgow +6 |
For the most part these predictions look pretty sesnsible, although possibly a little too emphatic in some cases (assigning Zebre a 1/100000 chance of winning their away fixture against Munster might be seen as a little harsh), and in one case slightly surprising: it gives Ospreys only an 8.3% chance of triumphing over Ulster at Ravenhill. There’s some obvious justification for this: in the last two years Ospreys have been beaten on that fixture, and only managed a marginal win three seasons ago. We’ll see how these play out against the real scores. For simplicity I haven’t included the margins of error for the predictions in this table, and the full probability distributions are further down the post.
The model used to generate the predictions is a Bayesian Hierarchical model based-off a model for the English Premier League which was presented in a blog post, and which is itself based off a paper by Baio and Blangiardo. The model was written-up in Python using the PyMC package to perform the MCMC sampling.
The model attempts to calculate the offensive and defensive efficiencies of each team in a league, so that we can make a plot of each team’s offensive strength against their defensive prowess.
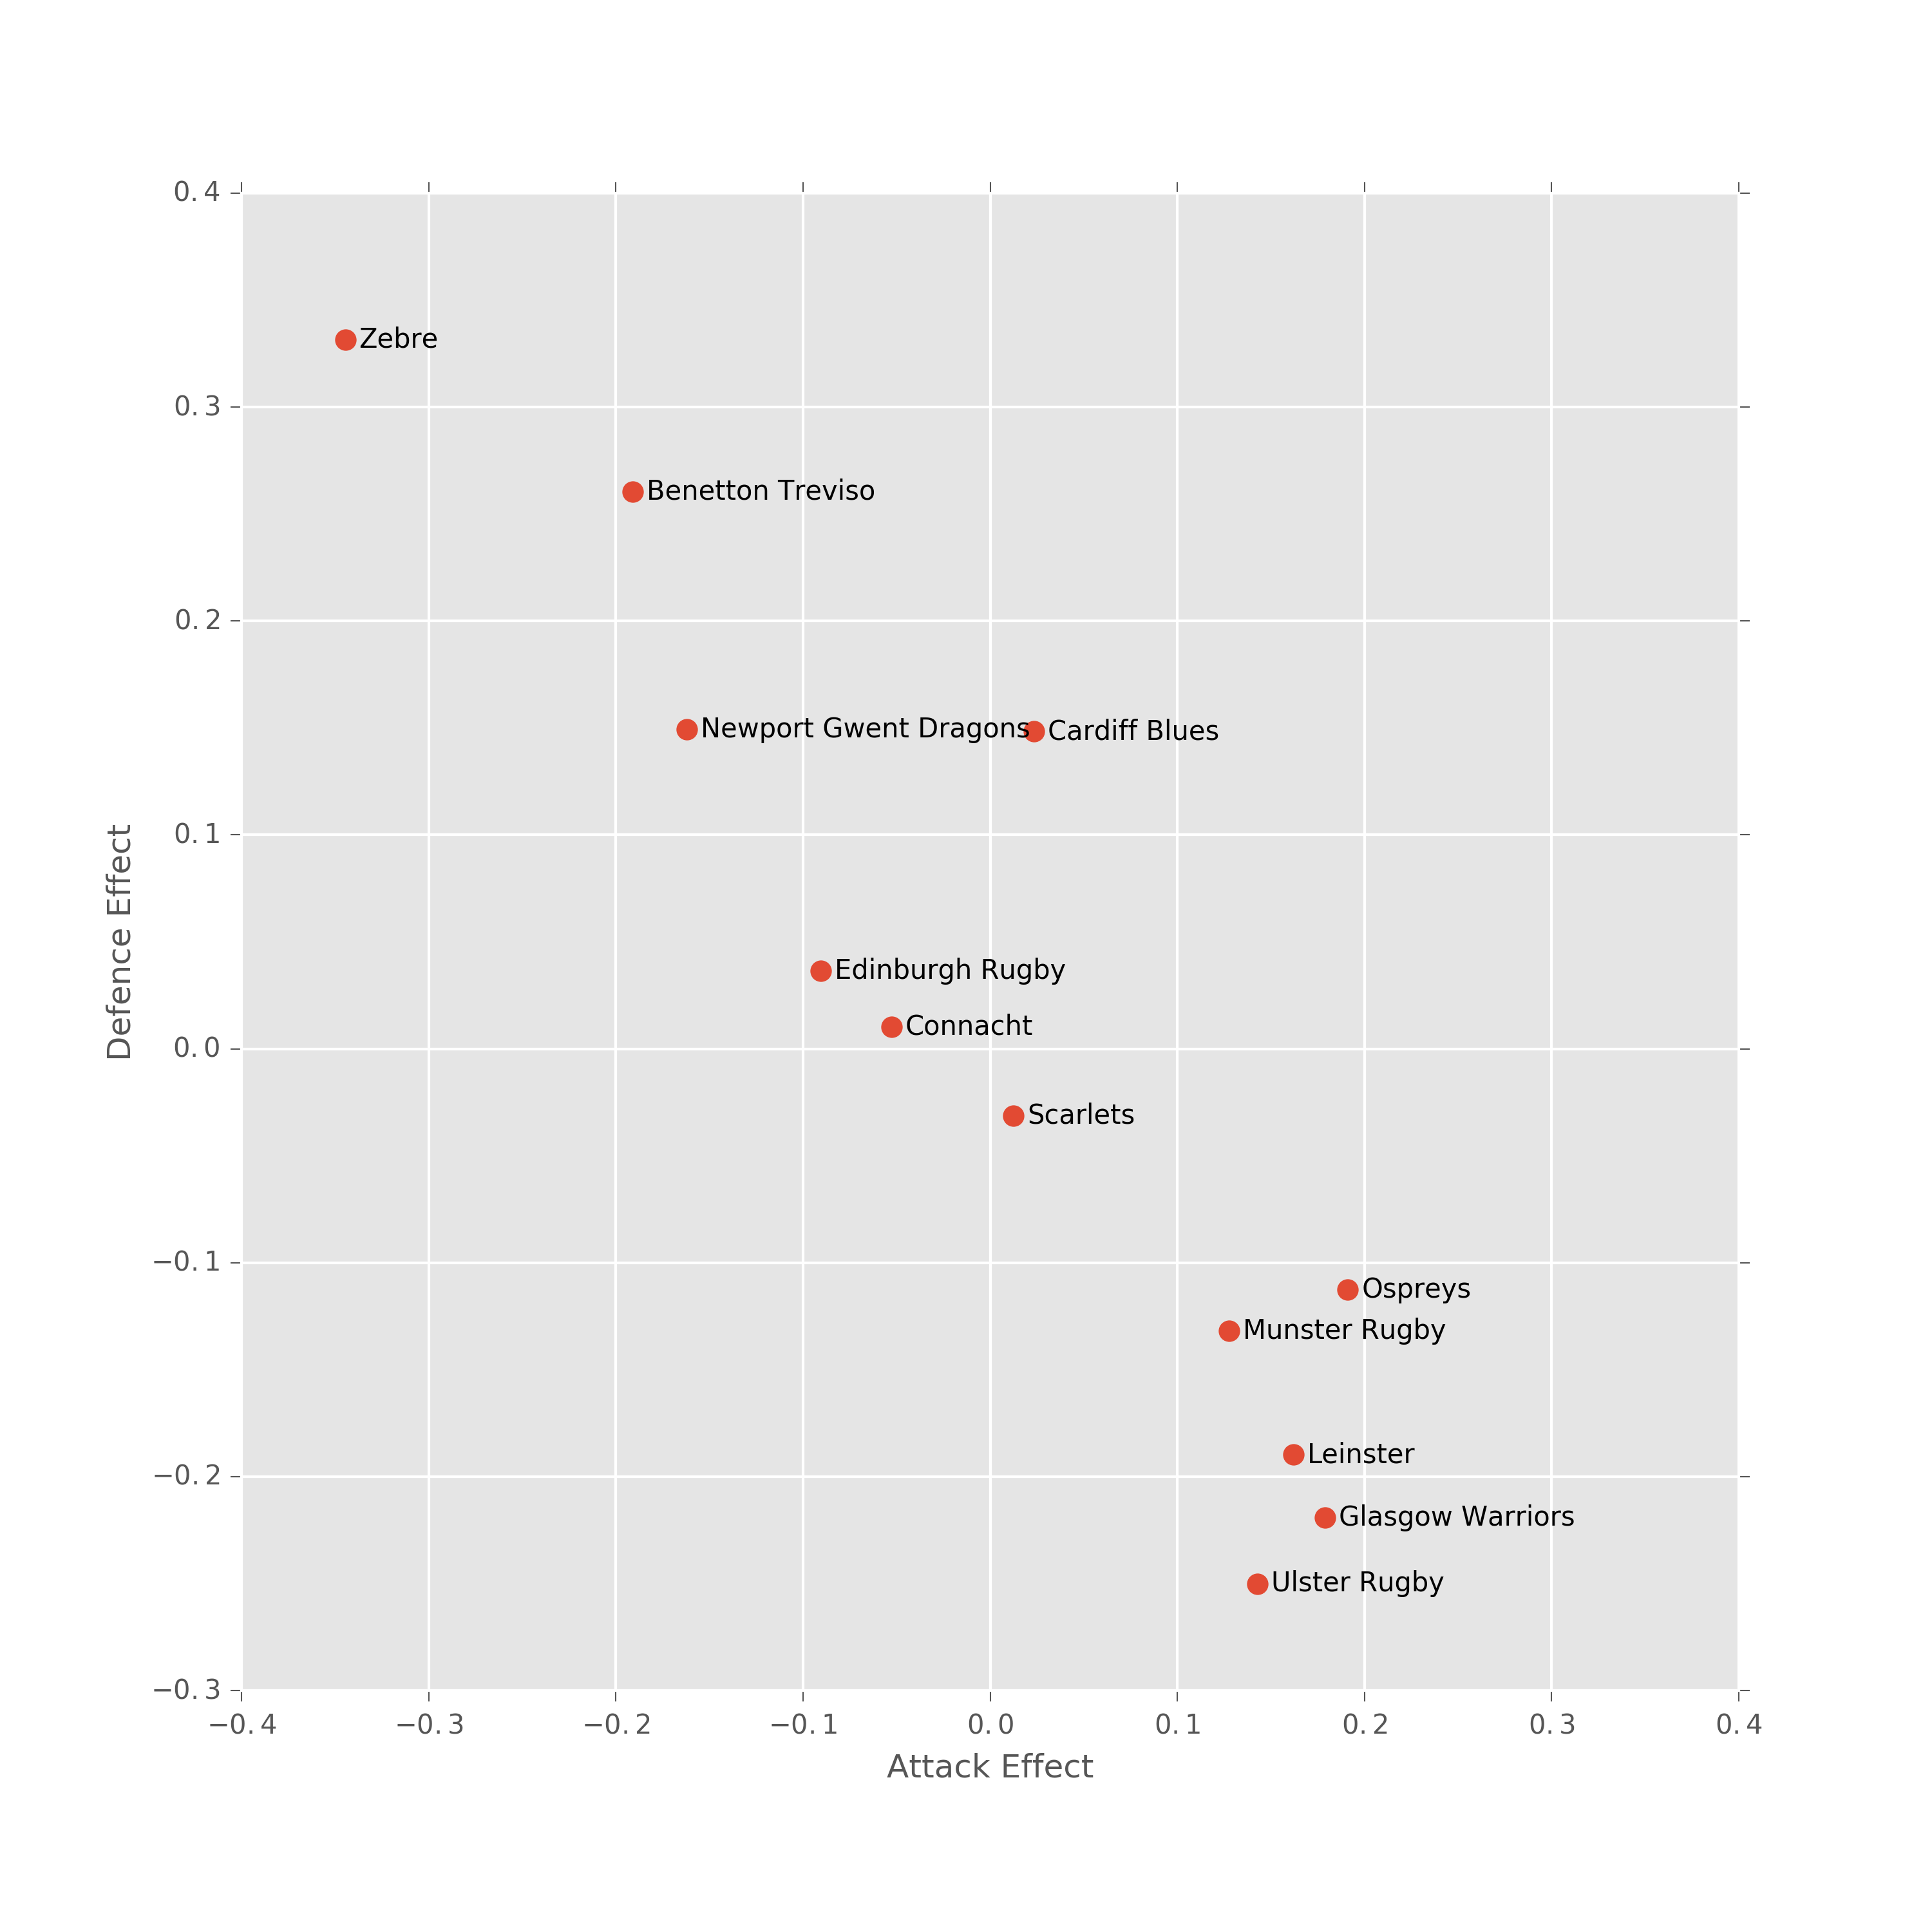
Team strengths in the Pro12.
Teams are plotted according to their relative offensive strength (on the x-axis) and their defensive strength (on the y-axis). Note that the two scales run in opposite directions, so having a negative defensive effect, and positive offensive effect is desirable.
These two estimates form the basis of the model’s ability to make predictions. Alternative approaches to predicting game outcomes often rely on attempting to rank teams based on their performance, however the approach I’ve taken attempts to perform the analysis by considering attacking strength and defensive ability separately. In the plot above we can see some nice (and expected) features in the data. First is the cluster of three teams in the bottom-right of the chart: Ulster, Leinster, and Glasgow. These teams tend to finish in the top 4 by the end of the season, and their combiation of attack and defense clearly works well. The mid-table grouping of Edinburgh, Connacht, and Scarlets is also unsurprising. The apparent clustering suggests that we shouldn’t really think of the Pro12 as having a top-, middle-, and bottom-tier, however, as I think an argument could be made for there being five, or even six clusters.
There are plenty of places with scope for improvement in this model, and it’s not immediately clear that adapting a model designed for football, where there is one form of scoring, each worth one point, to a sport with four methods of scoring worth between two and five points, is entirely legitimate. In the future I may turn development towards modelling tries and penalties separately, for example. Another interesting comparison to make, again for the near future, is how teams from other leagues compare to the pro12 teams (and therefore how we might expect matches in the European cups to turn out). Then there’s the problem of how quickly this kind of model can react to a team experiencing a sudden dip (or improvement) in performance. But first, let’s see how this weekend plays out!
Oh and those distributions I promised; apologies for their roughness, I’ll need to find time to get nicer ones in the future!